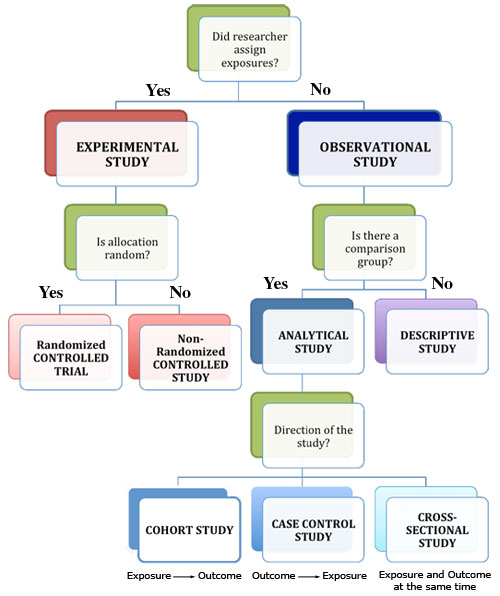
Identifying the Study Design
The type of study can generally be worked at by looking at three issues:
Q1. What was the aim of the study?
- To simply describe a population (PO questions) = descriptive
- To quantify the relationship between factors (PICO questions) = analytic.
Q2. If analytic, was the intervention randomly allocated?
- Yes? = RCT
- No? = Observational study
For an observational study, the main type will then depend on the timing of the measurement of outcome, so our third question is:
Q3. When were the outcomes determined?
- Some time after the exposure or intervention? = Cohort study ('prospective study')
- At the same time as the exposure or intervention? = Cross sectional study or survey
- Before the exposure was determined? = Case-control study ('retrospective study' based on recall of the exposure)
What is "Confidence Interval"?
A confidence interval (CI) can be used to show within which interval the population's mean score will probably fall. Most reseachers use a CI of 95%. By using a CI of 95%, researchers accept there is a 5% chance they have made the wrong decision in treatment. Therefore if 0 falls within the agreed CI, it can be concluded that there is no significant difference between the two treatments. When 0 lies outside the CI, researchers will conclude that there is a statisticallyHalfens significant difference.
Halfens, R. G., & Meijers, J. M. (2013). Back to basics: an introduction to statistics. Journal Of Wound Care, 22(5), 248-251.
Flow Chart of Study Designs
What is "p-value?"
Categorical (nominal) tests
This category of tests can be used when the dependent, or outcome, variable is categorical (nominal), such as the difference between two wound treatments and the healing of the wound (healed versus nonhealed). One of the most used tests in this category is the chisquared test (χ2). The chisquared statistic is calculated by comparing the differences between the observed and the expected frequencies. The expected frequencies are the frequencies that would be found if there was no relationship between the two variables.
Based on the calculated χ2 statistic, a probability (p value) is given, which indicates the probability that the two means are not different from each other. Researchers are often satisfied if the probability is 5% or less, which means that the researchers would conclude that for p < 0.05, there is a significant difference. A p value ≥ 0.05 suggests that there is no significant difference between the means.
Halfens, R. G., & Meijers, J. M. (2013). Back to basics: an introduction to statistics. Journal Of Wound Care, 22(5), 248-251.